
How to Read a Google Ads Report Without Being Misled By It

Most misleading advertising reports contain no false numbers at all.
That is what makes them difficult. The impressions figure is correct. The click-through rate is correct. The conversion count is correct. And the story the report tells, that the month went well, is not the story the account actually lived.
Reports mislead structurally rather than dishonestly. They lead with the metrics that are easiest to improve, inherit settings that quietly frame the data favourably, and omit the context that would turn a number into a judgement. Reading one properly is less about knowing definitions than about knowing the order in which to ask questions.
The full guide — How to Read a Google Ads Report (Without Being Misled By It) expands each section below, includes a worked example of one month's data read two ways, and closes with a ten-point reporting integrity checklist you can run against the next report you receive. Don't feel like reading the whole article, just download the guide.

The three questions a report has to answer
Before looking at a single figure, know what you are looking for. A useful report answers three questions in plain language.
Are we hitting the targets we set? Cost per conversion against target. Return on ad spend against target. Direction of travel over a meaningful period.
Where is the budget going, and is that allocation correct? Spend by campaign, impression share and where it is being lost, and whether the campaigns carrying the budget are the campaigns carrying the outcomes.
What changed, what did we learn, and what happens next? What was tested, what won, what was paused, what the coming month looks like.
The third question is the one most often missing, and its absence is diagnostic. Reporting that never contains a hard conversation, never a paused campaign, never a failed test, never a metric moving the wrong way, is usually reporting built for approval rather than for improvement.

A static report showing last month's numbers with no narrative attached is a record of the past. It is not a plan, and it should not be accepted as one.
Activity is not outcome
The single most useful habit in reading paid media reporting is sorting every metric into two piles before reading any of them.
One pile describes what the advertising did: impressions, clicks, click-through rate, average cost per click, Quality Score. The other describes what the business got: conversions, cost per conversion, conversion rate, return on ad spend.
Activity metrics are not worthless, they are diagnostic. A collapse in impressions explains a collapse in conversions. A high click-through rate paired with a low conversion rate tells you the advertisement is attracting the wrong audience, which is a specific and fixable problem.

The failure is promoting them to verdicts. An account can post its best click-through rate on record in the same month its cost per acquisition rises by half. Every metric in the first pile can be improved without a single additional client being acquired: broaden the match types and impressions climb; rewrite the headlines and click-through rate climbs; a cheaper, colder audience will lower your average cost per click and raise nothing else.
Read outcomes first. Then reach for the activity metrics to explain them.
Start with the measurement, not the metrics
Before any figure can be trusted, one question has to be settled: is the account measuring the right thing, and is it still measuring it correctly today?
If conversion tracking is broken, misconfigured, or counting the wrong action, every number downstream is fiction, and automated bidding will have spent the month optimising towards that fiction, finding more of exactly the wrong people.

Three checks settle it. Confirm the conversion actions show an active recording status rather than an unverified or misconfigured one. Confirm what is actually being counted, a form submission on a thank-you page is a very different quality of signal from a page view or a button click. And confirm that tracking has not silently broken since the last website release, which is where most measurement failures originate.
Straight from the source:
What is actually inside the conversion column
Most accounts track several actions of very different value and then report them in a single total. A purchase and a newsletter sign-up arrive in the same column, and the column flatters the account.
Google Ads separates these deliberately. Primary conversion actions are counted in the "Conversions" column and used by Smart Bidding. Secondary actions are recorded and reported but do not drive optimisation. It is among the most consequential settings in any account, and it is frequently left wherever it defaulted on the day tracking was installed.

If a report shows conversions rising while revenue is flat, this is almost always the explanation.
Straight from the source:
Attribution windows change the past
A conversion window is the period after a click within which a conversion can still be credited to that click. Change it and last month's performance changes with it, without a single alteration to bids, budgets or creative.
The mismatch to look for is between the window and the real sales cycle. A business whose clients take three months to decide, reporting on a thirty-day window, is systematically undercounting paid search and will underinvest accordingly.
Attribution model matters for the same reason: the credit assigned to a click depends on the model applied, so a change of model can swing conversion counts substantially while the account itself is unchanged.
If the reporting basis changed, the comparison is not a comparison. Establish the settings first, then read the trend.
The four metrics that carry a decision
Cost per conversion is the figure that establishes whether the account is profitable at unit level — but only against a target drawn from your own economics. Take the value of a client, apply the rate at which qualified leads become clients, and the affordable cost per lead falls out of the arithmetic. Without that number, "our cost per lead moved from $180 to $220" is a sentence with no verdict attached.
Conversion rate locates the fault. Healthy clicks with a low conversion rate means the traffic arrives and leaves — the advertisement is working and the page is not. Low clicks with a healthy conversion rate means the constraint is upstream, in budget, bids or impression share. Both low usually means intent mismatch, and the search terms report is the place to start.
Return on ad spend measures revenue, not profit. Two accounts reporting an identical 4:1 return can sit on opposite sides of profitability once margin and returns are accounted for. It is also the number every platform inflates, because when several channels touch the same sale, each one claims it. A blended view — total revenue divided by total advertising spend across all channels — is cruder and much harder to game.
Impression share is only useful when split by cause. Impressions lost to budget mean the money ran out before the day did: a pacing problem, and if the campaign is profitable, an instruction to spend more. Impressions lost to rank mean you were eligible and were beaten on bid, relevance or landing page experience — and additional budget will not fix that.
The tab most reports never show you
Keywords are what you bid on. Search terms are what people actually typed. The gap between them is where budget quietly leaves the account.
Irrelevant terms do more damage than the wasted spend suggests, because automated bidding learns from the conversions and non-conversions it observes. A campaign accumulating clicks from people who were never going to buy is actively being taught to find more of them.
The review is defensive and offensive at once: exclude what will never convert, and promote what is already converting into tightly themed groups where the message can be matched to it properly.
Three defaults that flatter performance
None of these are errors. Each is a setting chosen for you, and each shapes the conclusion a reader reaches.
The default date range places the last thirty days beside the thirty before, which puts a strong month next to a quiet one and calls the difference a trend. Compare with the equivalent period last year as well.
The default conversion column may include micro-conversions that never became revenue. Segment it before concluding anything about volume.
Automated recommendations are generated to improve performance as the platform measures it, and many are genuinely useful. Some also increase spend. Apply them individually, on their merits, and never in bulk.
Segment before you conclude
An account average is a blend, and blends conceal. A cost per acquisition of $86 looks tolerable; split by device it may show desktop at half the target and mobile at twice it — which is not a bidding problem to be solved with a percentage adjustment, but a mobile experience that needs rebuilding.
Four segmentations answer most questions: device, network, geography and time of day. Each takes seconds to apply, and each is capable of overturning the conclusion the headline number invited.
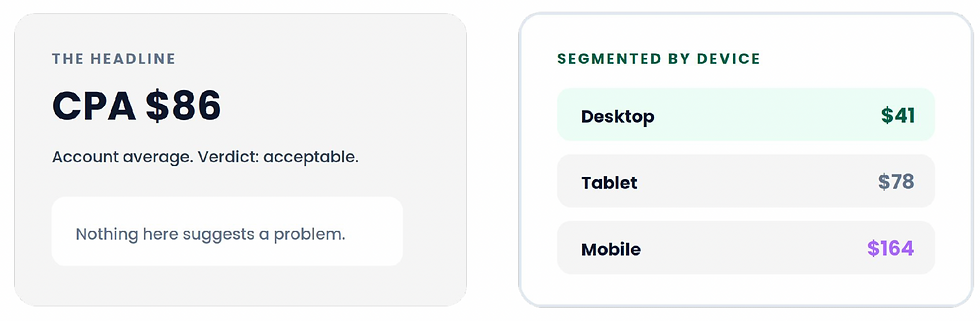
If a report contains no segmentation at all, it has not been analysed. It has been exported.
Reading any report in ten minutes
The order matters more than the time.
Confirm tracking is live and correctly scoped. This is a gate, not a step. If it fails, stop.
Read cost per conversion against target. Is there a problem?
Read conversion rate. Is the problem in the campaign or on the website?
Check impression share and where it is being lost. Is the constraint money or competitiveness?
Pull the search terms report for the last fortnight. Where is the specific waste?
Ten minutes will not optimise an account. It will reliably tell you whether the account is healthy and, if it is not, which conversation to have next — which is what most people actually need from a monthly report.
Where the reporting lives:
The eight questions worth asking
Whether your reporting comes from an internal team, an agency or a partner, these are difficult to answer well without a properly managed account.
What is our target cost per conversion, and where did that figure come from?
Which conversion actions are set as primary, and what exactly do they count?
What attribution model and conversion window are we reporting on, and have they changed?
Are we losing impression share to budget or to rank?
What did the search terms report show in the last fortnight, and what was excluded?
Which campaigns did we pause or reduce this month, and why?
What was tested, what was the result, and what is the next test?
Can we have direct administrative access to the account itself?
The last one is the most revealing. A partner unwilling to grant administrative access to an account you are paying for is describing a relationship, not a technical constraint.
Take it further

The full guide — How to Read a Google Ads Report (Without Being Misled By It) expands each section above, includes a worked example of one month's data read two ways, and closes with a ten-point reporting integrity checklist you can run against the next report you receive.
If you have read this far, you probably already know which parts of your own reporting you cannot currently answer for. Our specialists review Google Ads accounts against the same framework: measurement integrity first, then structure, targeting, bidding, creative and the search terms actually being paid for. You receive a written assessment of what is working, what is costing money, and what to do about it over the next thirty days, provided at no additional cost to your media investment.


Comments